
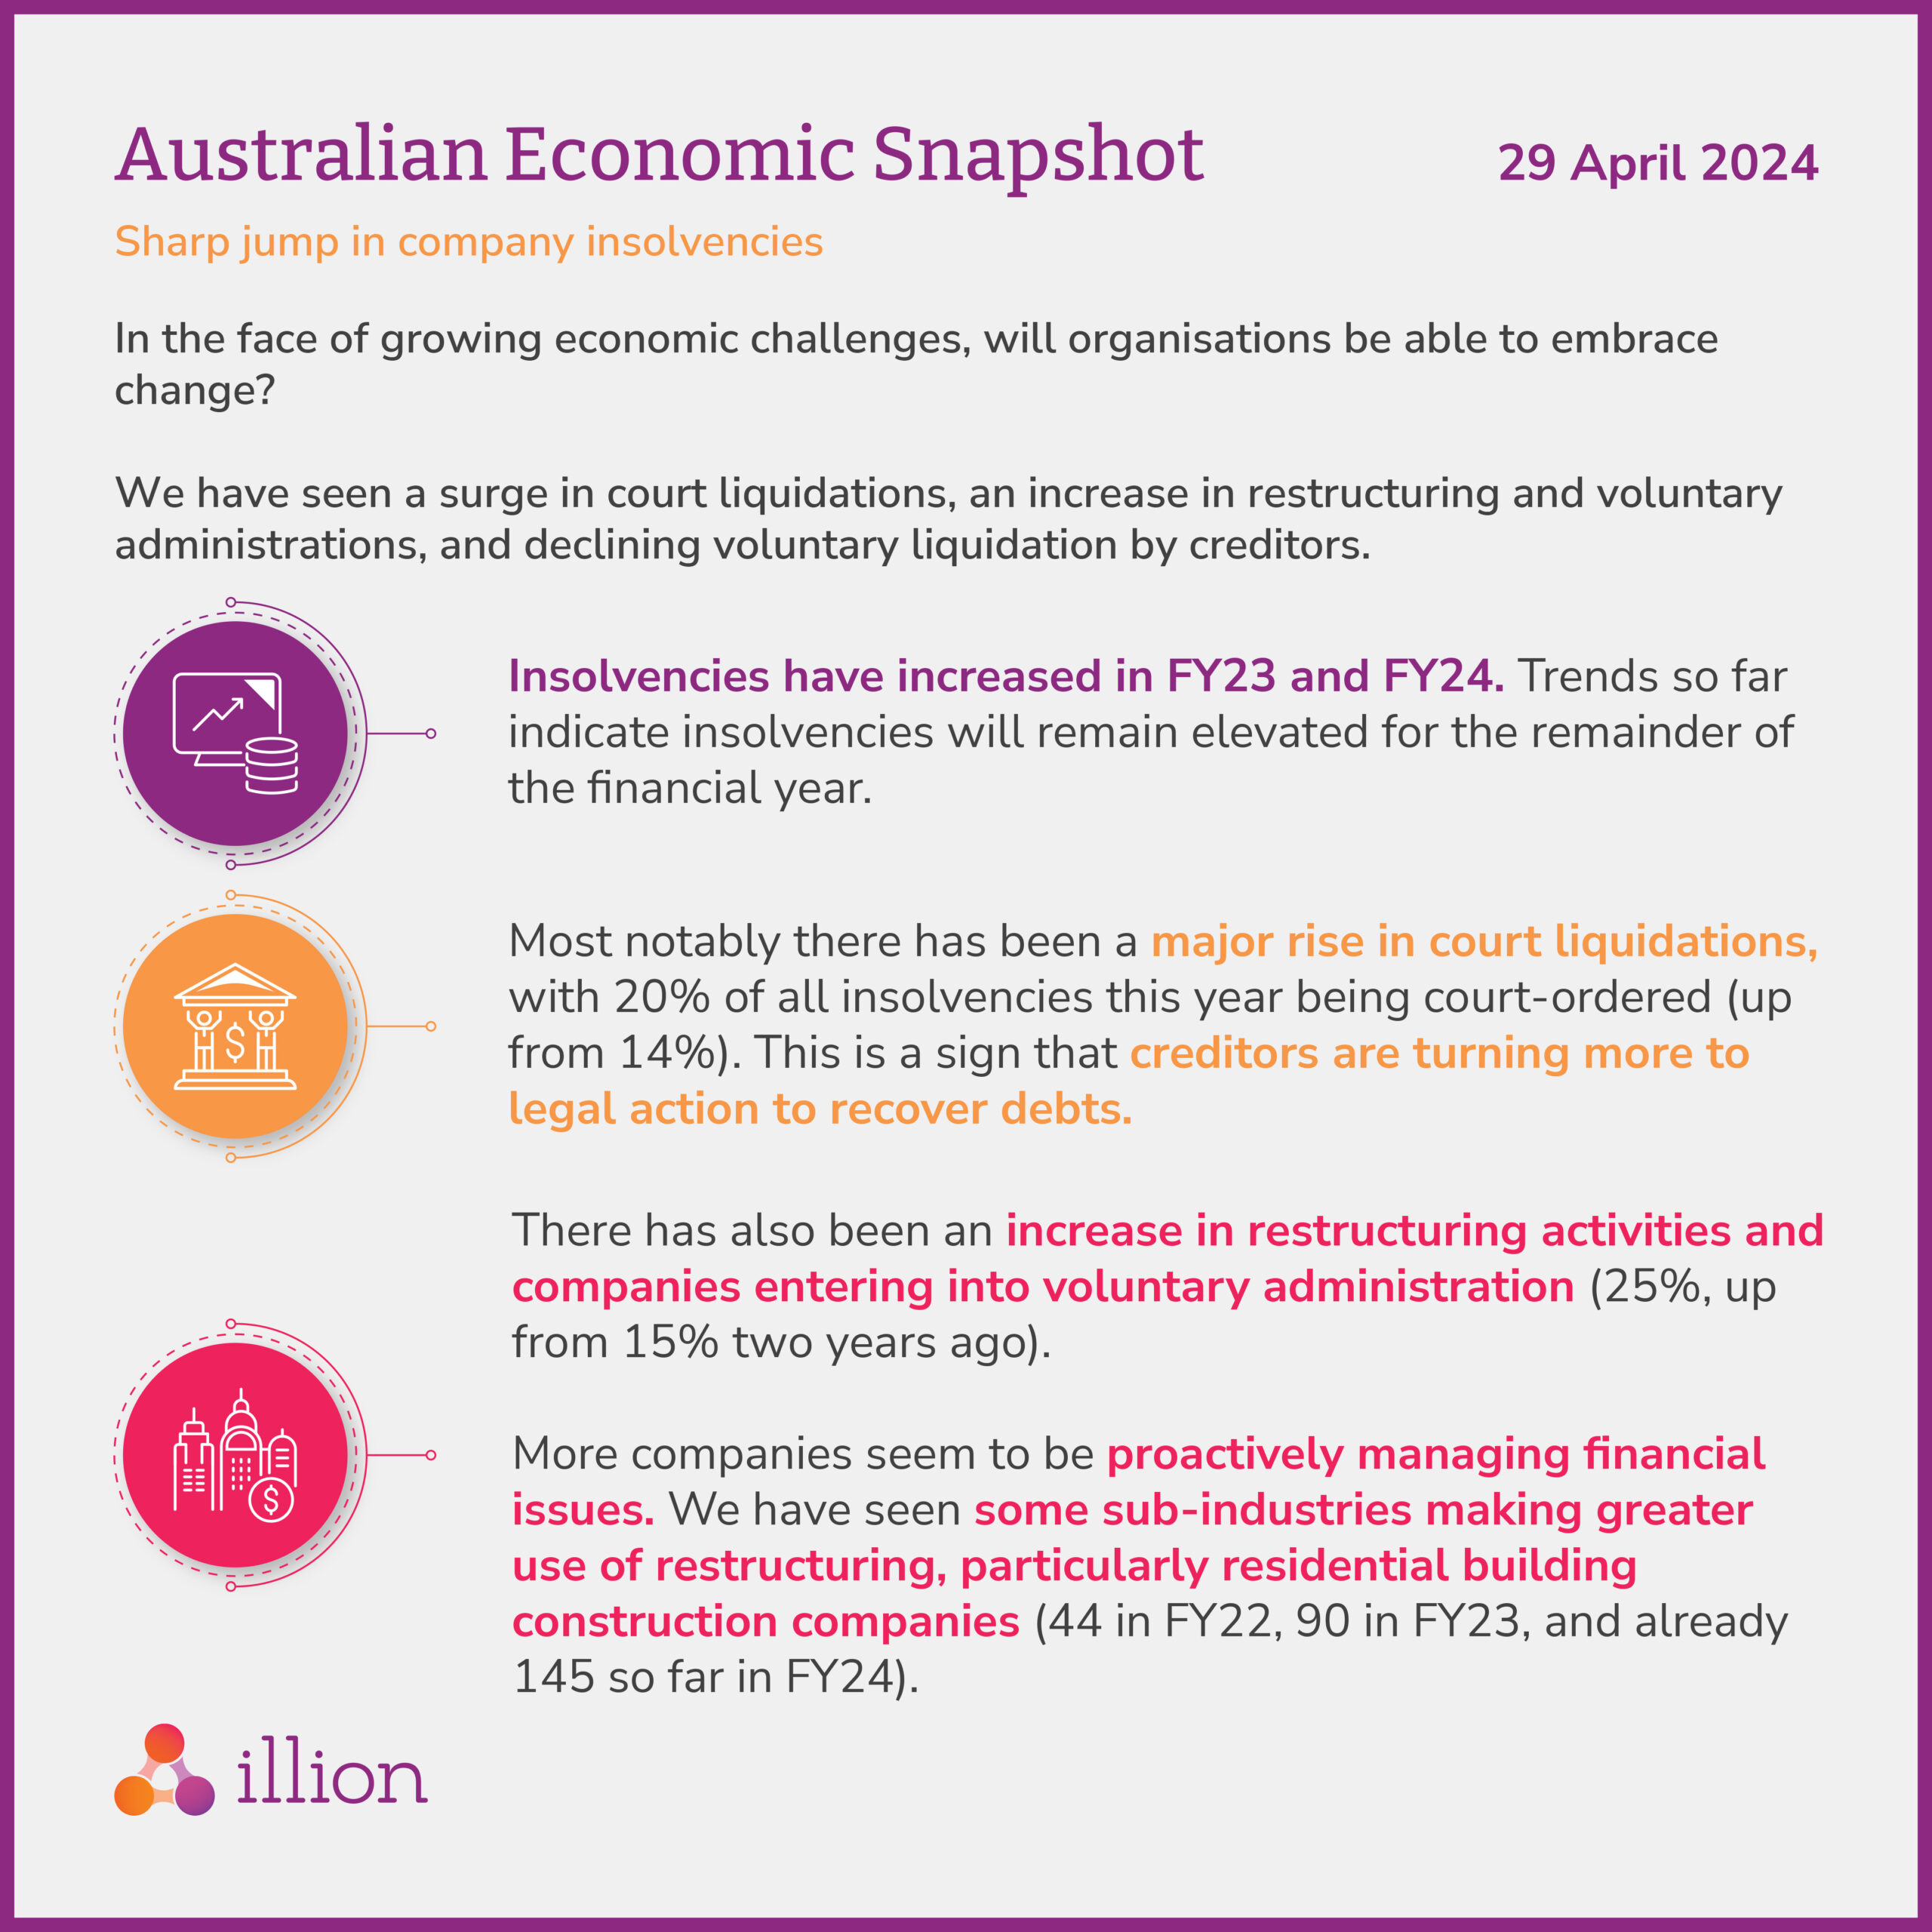
We have seen a significant surge in business insolvencies in FY2023 and FY2024, a trend that is likely to continue for the remainder of the financial year.
With the continued increase in economic challenges, will companies be able to adapt?
Find out more in our Economic Snapshot below:

Behind the Data: The who, what, where, when and why behind the data

Who: The analysis has been compiled by illion’s Head of Analytics Louis Tsang
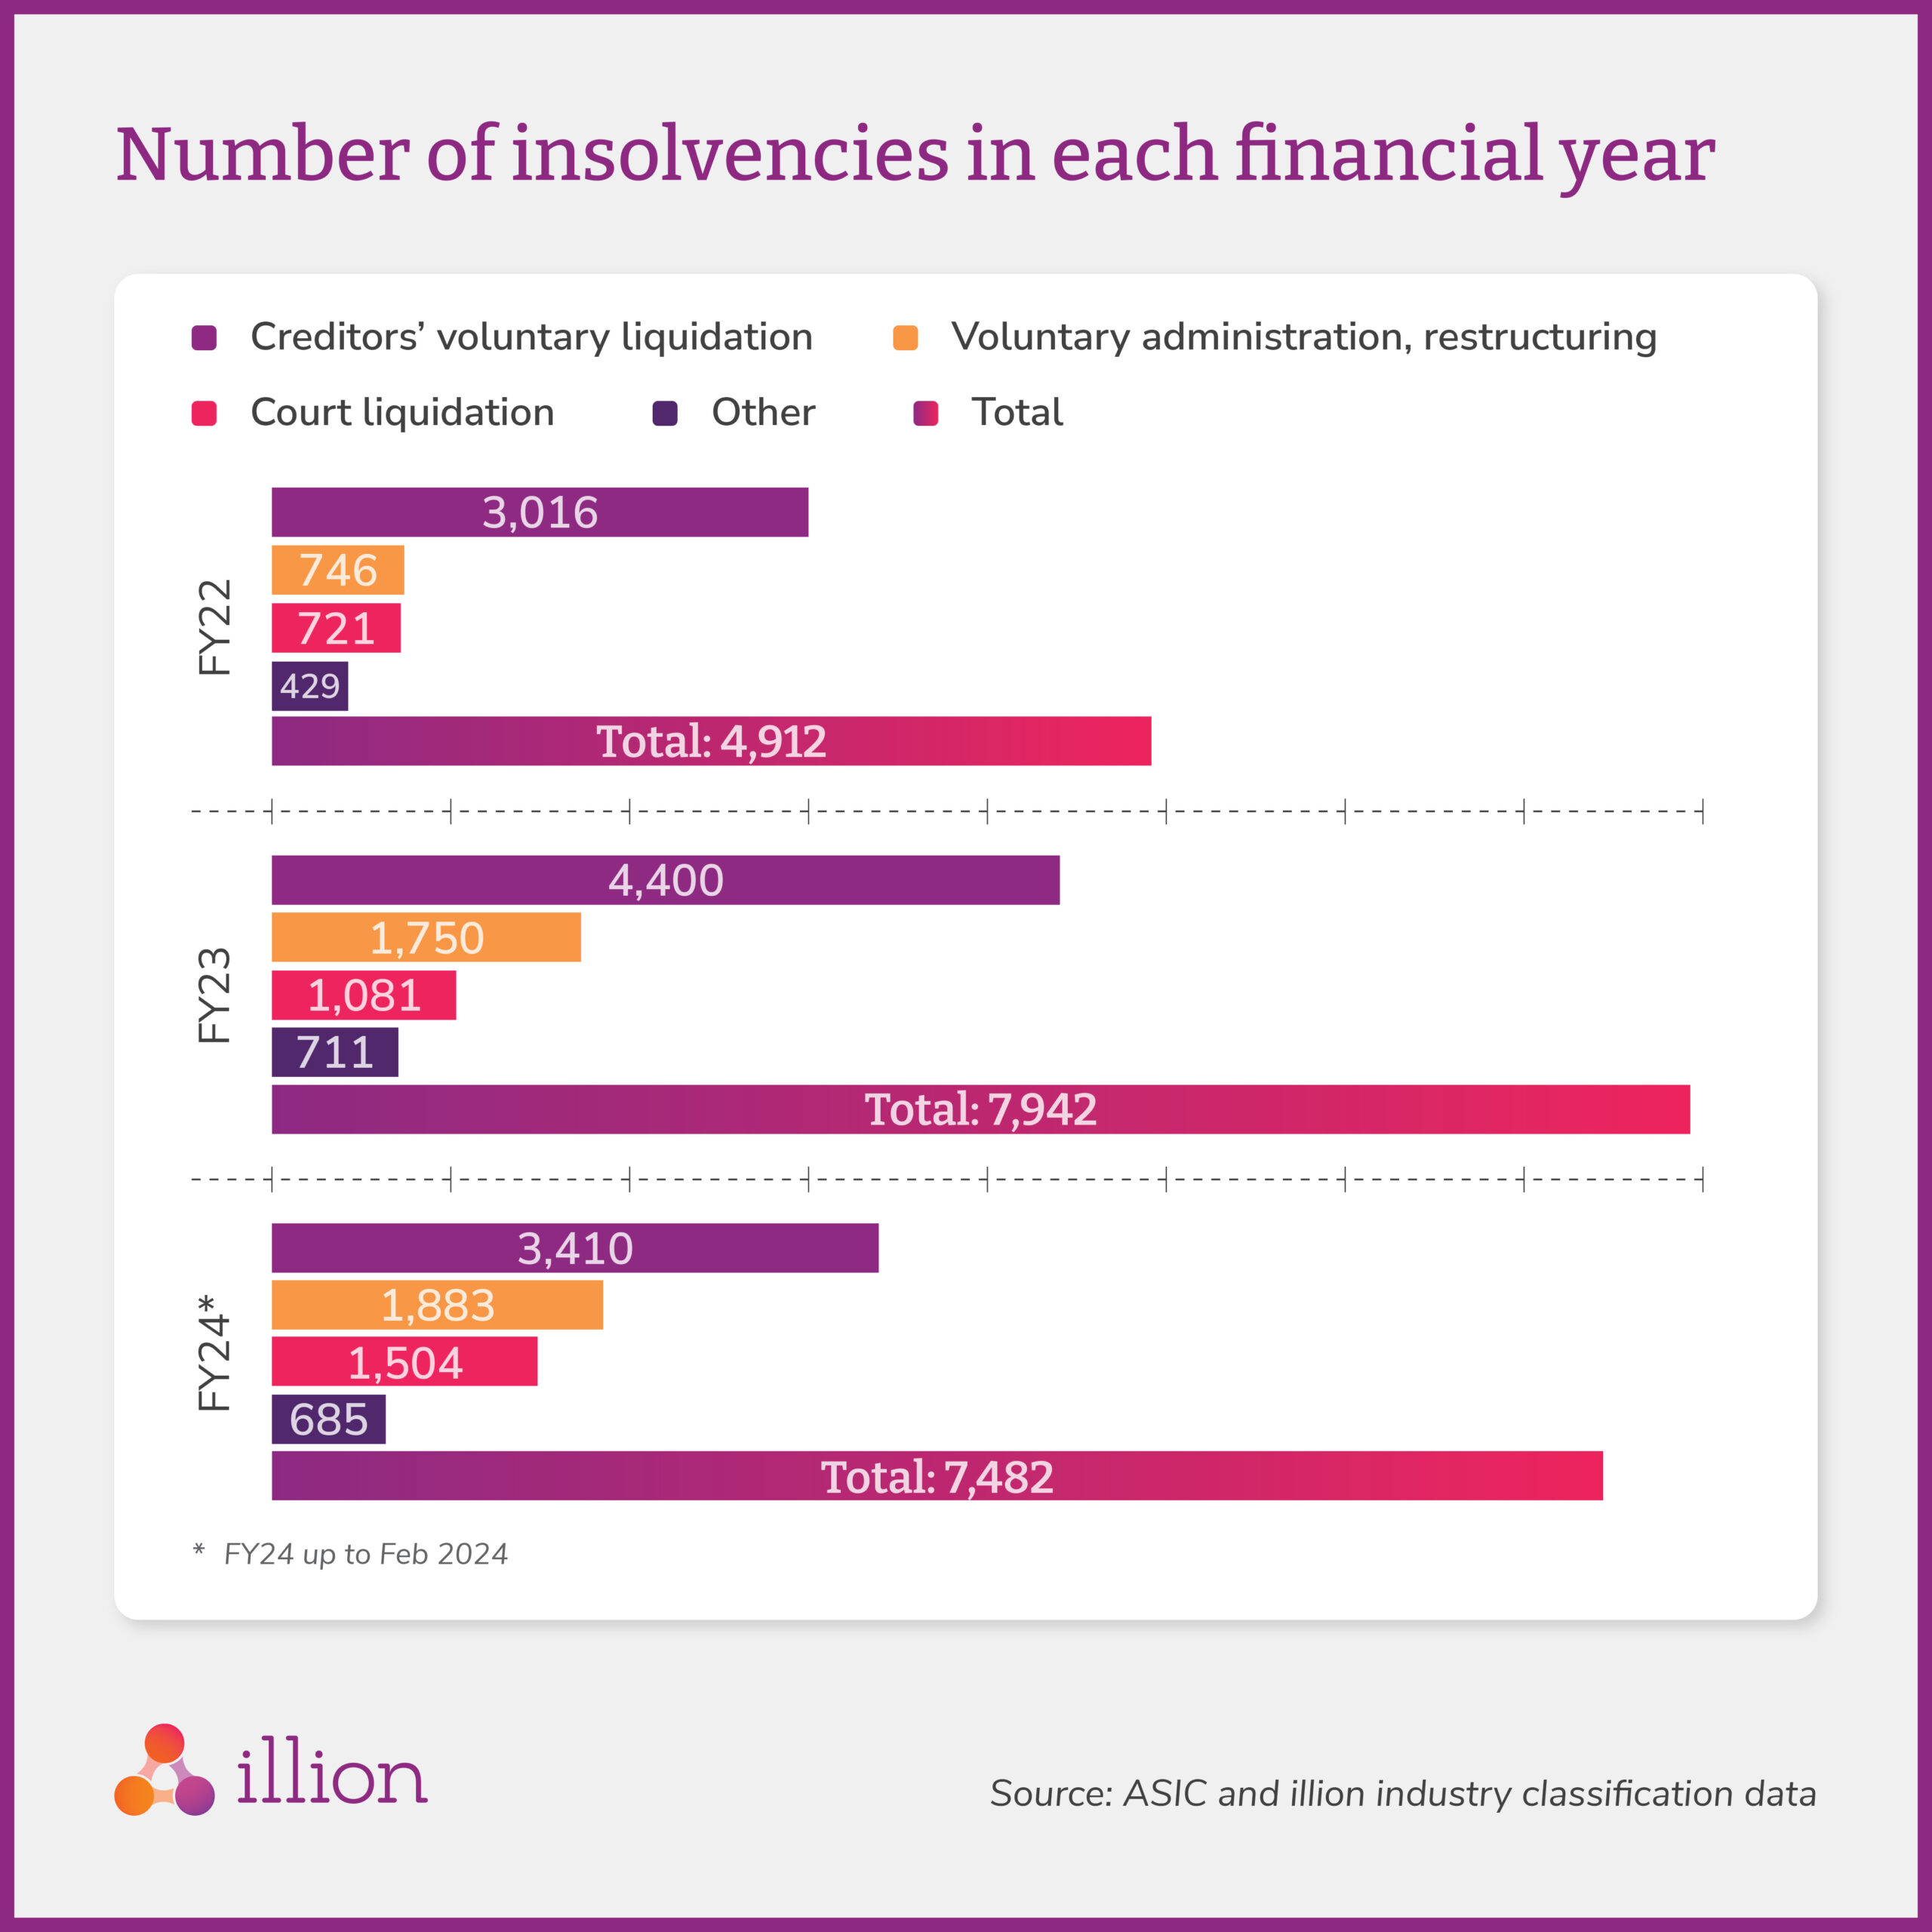
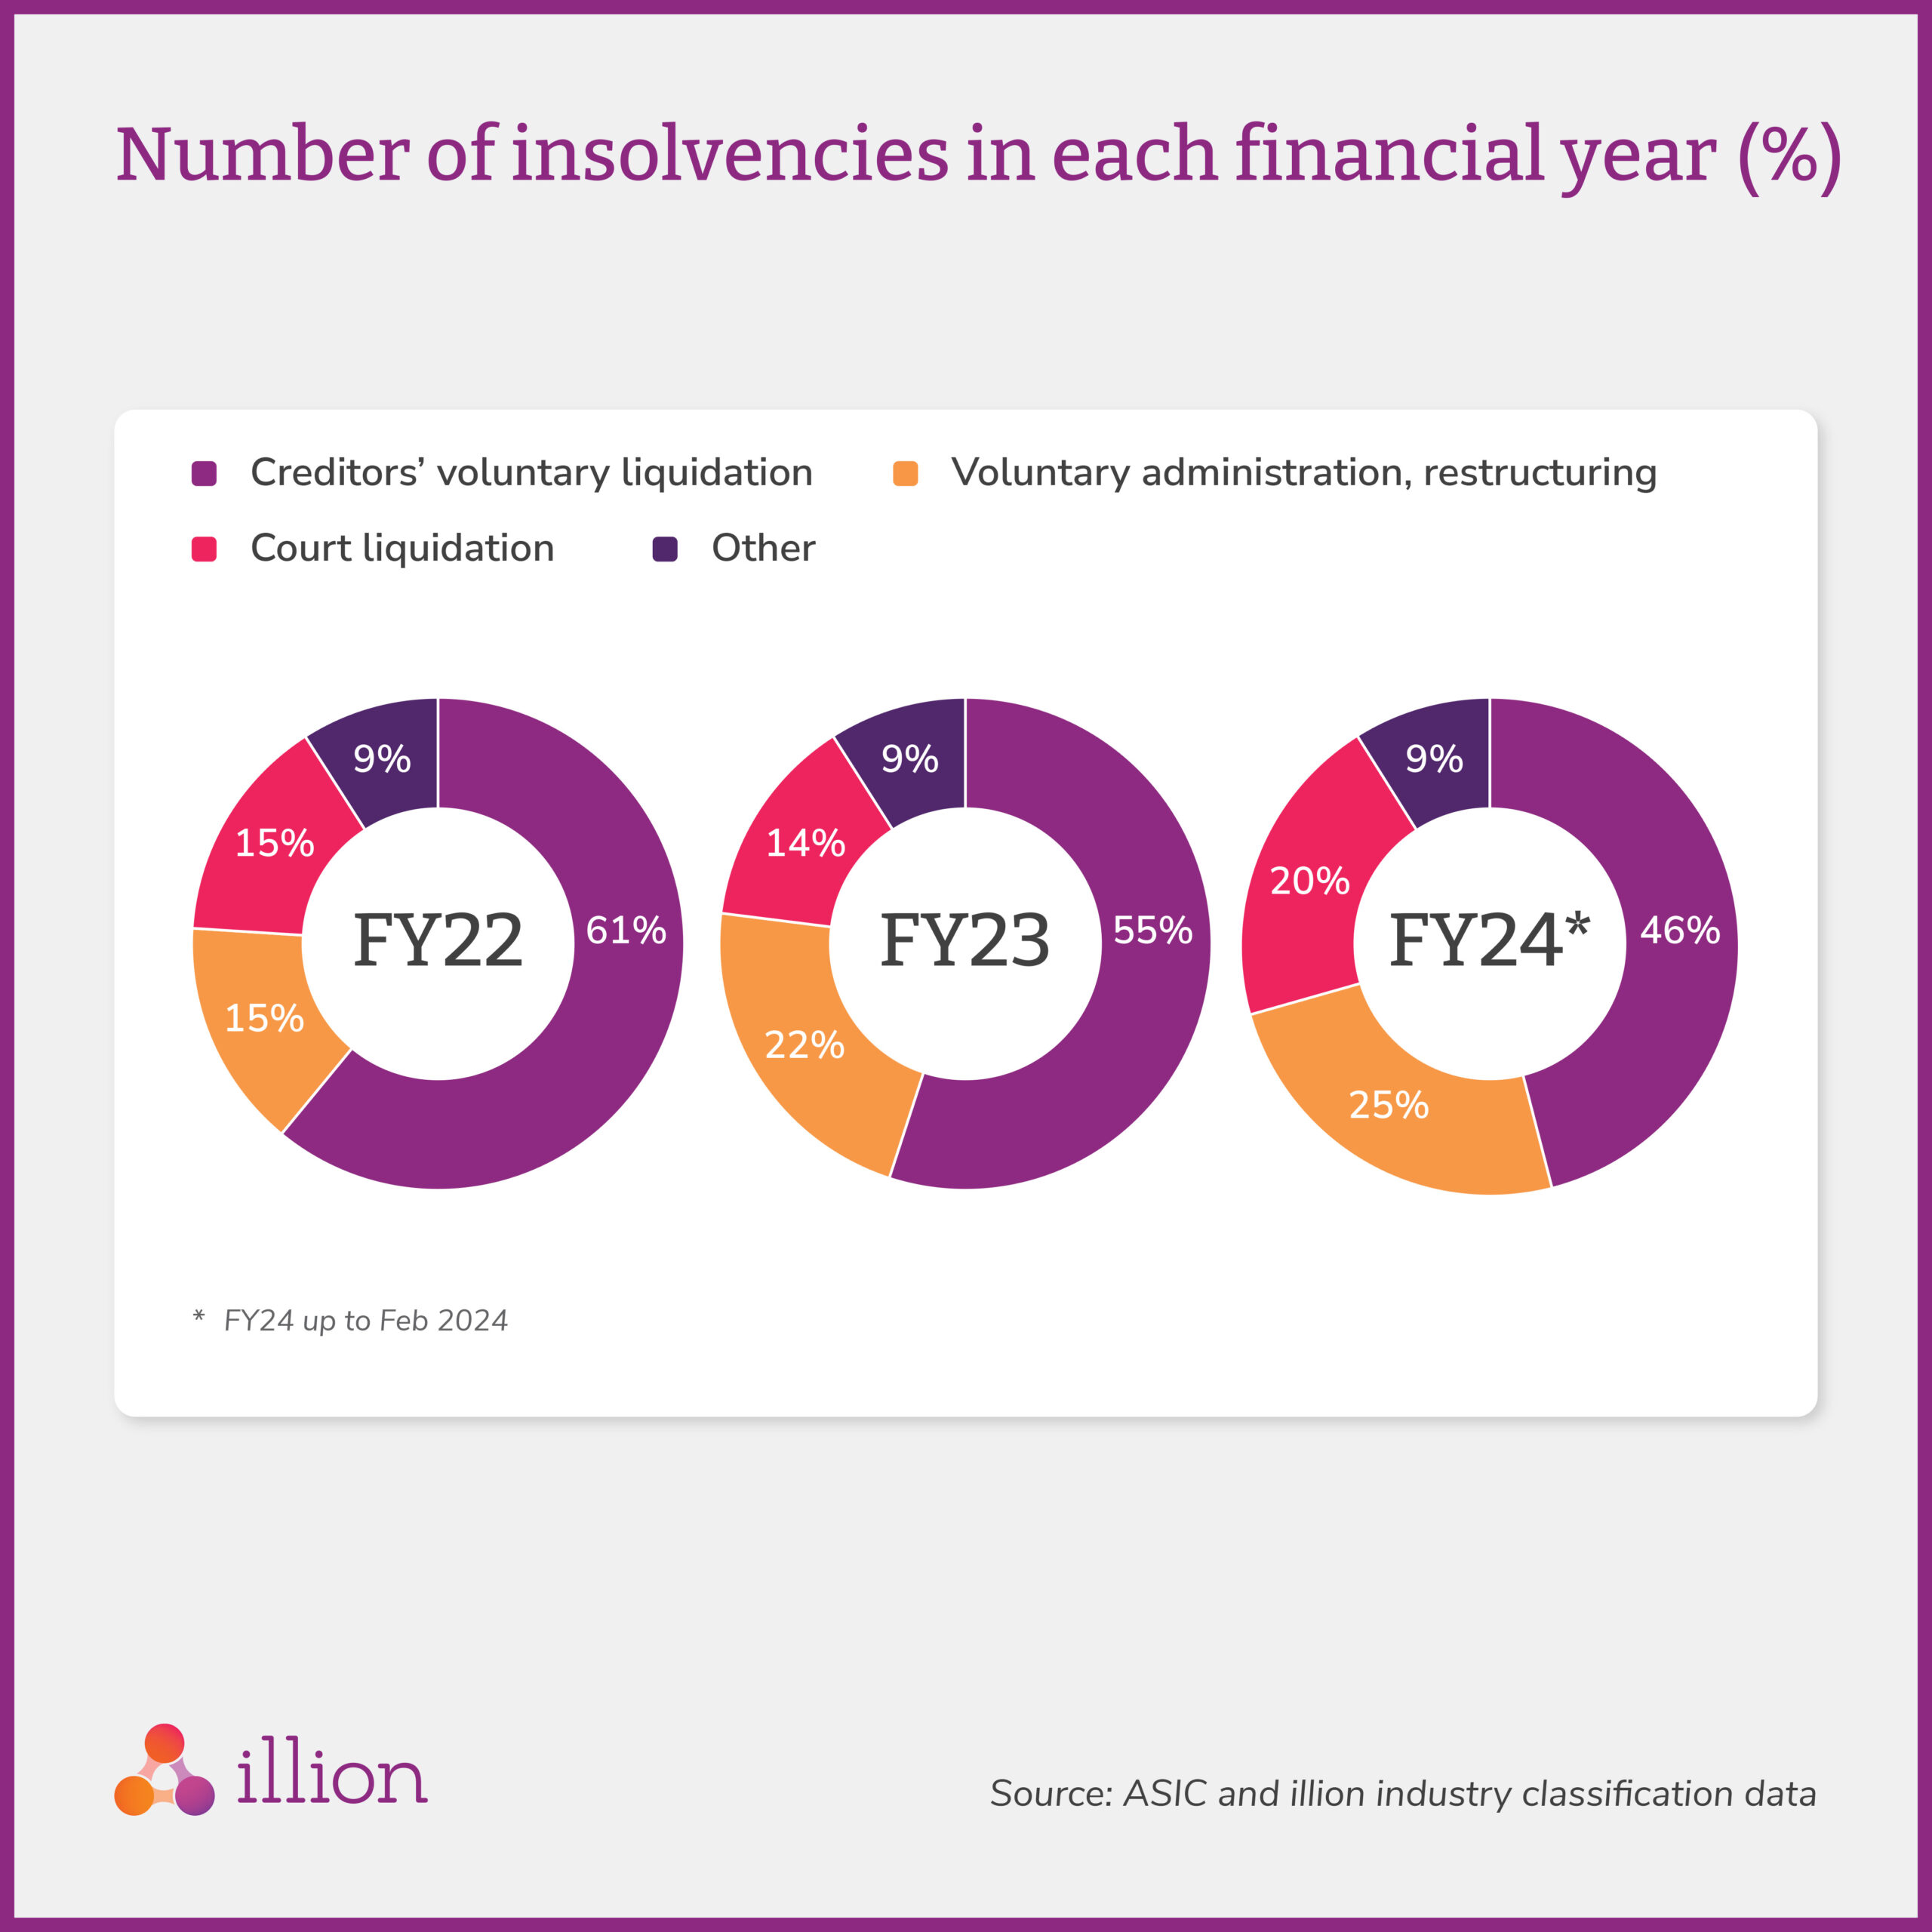
What: The analysis looks at insolvency data in Australia. The data has been sourced from ASIC, with illion’s comprehensive industry classification data overlayed on top.
Where: The focus is on Australian companies.
When: Insolvency numbers have increased significantly over the past 24 months, although this has been more concentrated on particular at-risk industries (construction, accommodation, and food services).
Over the past 24 months, we have also observed a shift in the type of insolvencies being reported, which could indicate shifting sentiment in how creditors and companies are managing financial issues and debts.
Why: As different industries will have different insolvency profiles, it is important to monitor this shift to understand how companies are managing their financial issues and financial health.
Want to learn more?
Fill in this form to talk to our friendly team today.